
Is Screen Time Accurate? Your Estimate Isn’t, and Nobody Has Checked the App
Your own screen-time estimate is usually wrong. But the number shown by your phone has barely been validated against independent logs.
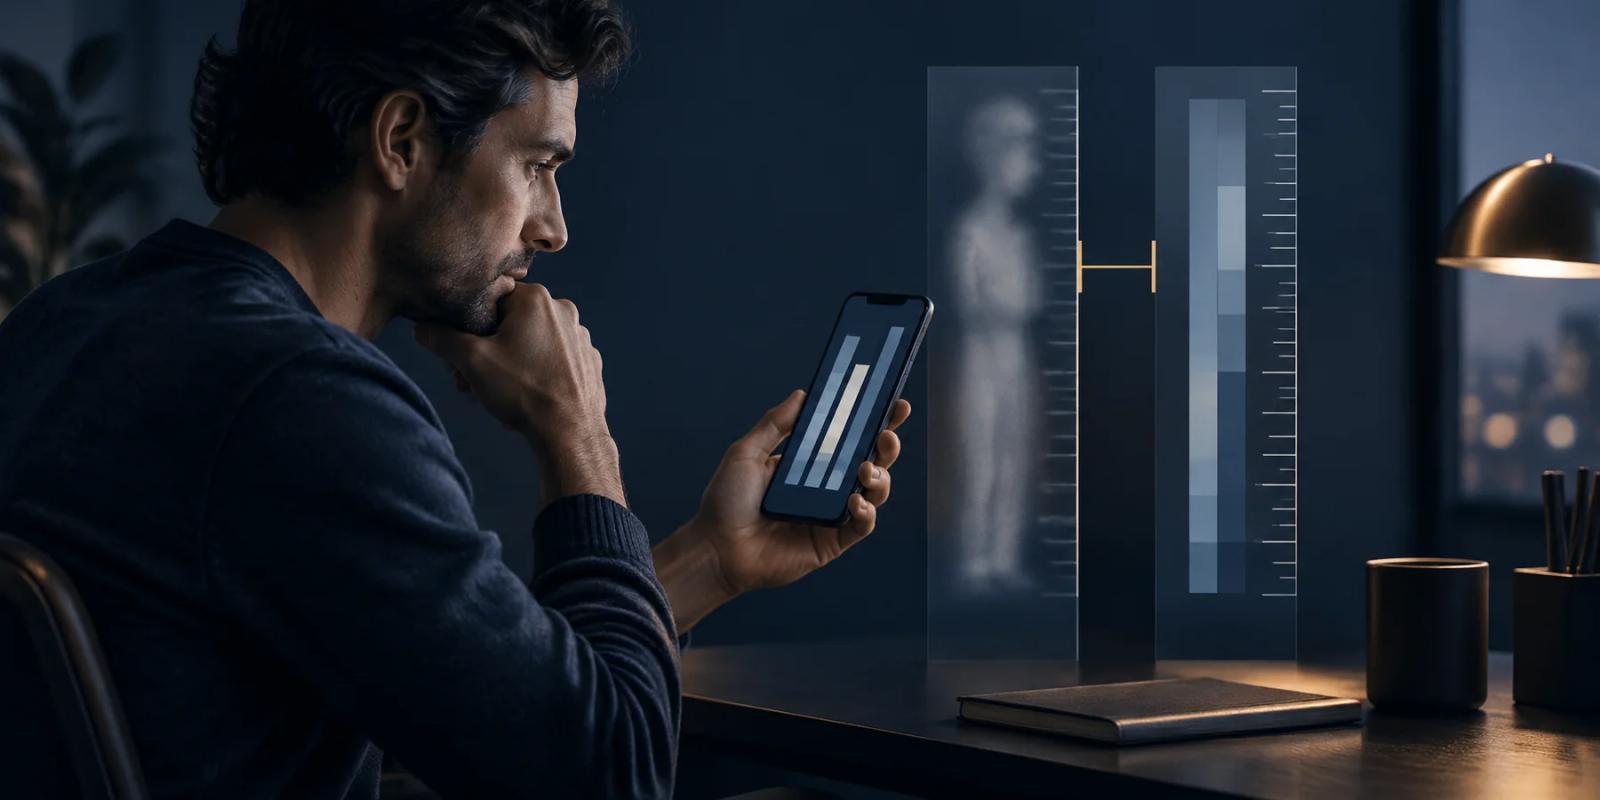
There are two questions hiding inside this one, and they have very different answers.
The first is whether your own estimate of how much you use your phone is accurate. It is not, and the evidence for that is unusually strong.
The second is whether the number your phone shows you is accurate. That question has barely been asked. We could not locate a single published study validating Apple’s Screen Time or Android’s Digital Wellbeing against ground-truth logs - and researchers who rely on those numbers have said in print that they are aware of the risk.
That gap is the more interesting half of this article, because the second number is the one everyone now argues about.
What was actually measured
The best evidence is a systematic review and meta-analysis by Parry and colleagues (2021) in Nature Human Behaviour. The review screened its way down to 47 records and 106 effect sizes; the primary analysis pools 66 effect sizes from 44 studies, with a total sample of 52,007 people.
It compared what people said about their digital media use against what was actually logged on their devices.
The association was r = 0.38, 95% CI [0.33, 0.42], p < .001.
That is a moderate correlation. It is not nothing - people who use their phones more do tend to say they use their phones more. But it is nowhere near the agreement you would need to treat a self-report as a measurement.
The accuracy figures are more striking than the correlation. Of the 49 comparisons where the review could check how close the average self-report landed to the average log:
- Three (6.12%) fell within 5% of the logged mean.
- Twenty-three (46.94%) over-reported.
- Twenty-three (46.94%) under-reported.
Those three numbers account for all 49 comparisons. Roughly one estimate in sixteen was close, and the rest missed in both directions about equally.
The review declares no specific funding and no competing interests.
The finding that matters more for research than for you
Parry and colleagues also examined a specific class of instrument: the “problematic use” and “smartphone addiction” scales that ask you to agree or disagree with statements about losing control of your phone.
Those correlated with logged use at r = 0.25, 95% CI [0.20, 0.29] - across 40 effect sizes from 19 studies and 5,552 people.
This is worth sitting with. Scales designed to detect problematic phone use track actual phone use less well than ordinary duration estimates do. Whatever they are measuring, it is only loosely related to how much the phone is used.
Ellis and colleagues (2019) reached the same place from a different direction, with 238 iPhone owners whose usage was captured over a week. The Smartphone Addiction Scale correlated with logged pickups at r = .22 and with logged time at r = .40.
There is an irony in the method here that should be stated plainly: Ellis and colleagues used Apple’s own Screen Time as their objective measure. That is the tool this article is about to say nobody has validated.
Estimating duration is harder than estimating frequency
The blunt version - “self-report is broken” - is not quite right, and the more precise version is more useful.
Andrews and colleagues (2015), in PLOS ONE, logged two weeks of Android use for 23 participants. Their result splits cleanly in two:
- Duration: no significant discrepancy. Actual 5.05 hours a day against an estimated 4.12; t(22) = 1.78, p = .086. Underestimated, but not significantly so in a sample this size.
- Frequency: a large discrepancy. Actual 84.68 uses a day against an estimated 37.20; t = 3.93, p < .001, with the correlation between estimated and actual uses at r = .11, p = .610.
People underestimated how many times they picked the phone up by more than half, and the relationship between their guess and reality was essentially zero.
That is a sample of 23, and we are not going to pretend otherwise. Its value is in the pattern, which recurs.
Verbeij and colleagues (2021) tracked 125 Dutch adolescents on Android. Between-person validity ran .55 to .65; within-person, across days, it dropped to r = .32. They found consistent over-estimation - which sits somewhat awkwardly against Parry’s near-symmetric split, and is worth noting rather than smoothing over.
More recent work suggests the format of the question matters more than the fact of self-report. Research using logged TikTok metadata has found that Likert-type frequency items reach considerably higher agreement than free-text duration estimates. If you want a rough sense of whether someone is a heavy user, asking them is defensible. If you want minutes, it is not.
For historical grounding rather than evidence about screens: Boase and Ling (2013), using 2008 Norwegian data and server logs from 426 people, found self-reported call and text frequency correlating with logs at r = .55 and r = .58 for “yesterday” questions and lower for “how often” questions, with consistent over-reporting. That is calls and texts, before the smartphone era. It shows the problem is old, not that it applies to screen time.
The dissent, which is real
There is a serious counter-argument, and an article that ignored it would be doing the thing this programme exists not to do.
Jones-Jang and colleagues (2020), in the Journal of Computer-Mediated Communication, argue that if self-report error is largely random, it attenuates relationships rather than manufacturing them - which would make self-report studies conservative rather than misleading. In their words, “If self-reports suffer mostly from random errors, statistical analyses would produce smaller, conservative findings.”
They have data for it. Across two studies (N = 294 and N = 291), logged measures produced significantly more detected relationships than self-report did - 5 of 8 versus 1 of 8 in the first study, 5 of 8 versus 2 of 8 in the second. In Study 2, self-reported problematic use correlated with an outcome at r = -.03 while logged use correlated at r = .29, z = 3.22, p < .001.
Two things must be said alongside that.
First, the authors concede the point that matters most here: “logged data are neither entirely free from measurement errors nor always valid measures.” Their own self-report-to-log correlations were r = .36 and r = .50, below the reliability standard they themselves set.
Second, the argument has been directly contested. Wu-Ouyang and Chan (2023), with 777 participants, concluded that self-report “may either have no additional effect on or overestimate the communication findings,” which they present as challenging the random-error explanation and raising the possibility of false positives rather than false negatives.
This is not settled. Say so.
The unexamined ruler
Here is where the trail runs out.
Every finding above compares a person’s estimate against a log. Almost none of them interrogates the log. And for hundreds of millions of people, the log is now Apple’s Screen Time or Android’s Digital Wellbeing - a number produced by the company that makes the device, using a definition of “use” it does not fully publish.
We could not locate a single published validation study of either tool against independently captured ground truth. We are stating that as the outcome of a search, not as a proven absence.
What we did find is researchers flagging the same gap. Ohme and colleagues (2021) write, of their own method: “We rely on the output of the iOS Screen Time function and not actual log data. Using this type of third-party material in research bears the risk of inaccuracy in this type of data as well” - and they recommend “validating these measures, for example with specifically prepared phones that make actual log data available.”
More recent work has continued to use Screen Time as a data source without validating it.
So the honest position is this. When somebody quotes their Screen Time at you - including when that somebody is a researcher - the number has an unexamined instrument behind it. It is very probably closer to the truth than a guess. Nobody has published how much closer.
What this changes
Do not treat your weekly Screen Time figure as a measurement of a psychological state. It is a count of when an app was foregrounded, produced by a definition you cannot inspect. It is a reasonable relative signal - this week against last week, on the same phone, with the same settings.
Be much more sceptical of any statistic that begins “people report.” If a headline says the average person spends some number of hours on their phone and the source is a survey, the meta-analytic expectation is that roughly one estimate in sixteen lands within 5% of reality, and that the misses go both ways.
Be most sceptical of “phone addiction” percentages. Those come from scales that track logged use at r = 0.25. A number derived from them is not a measurement of how much anyone uses their phone.
Frequency is where your intuition fails worst. The clearest single discrepancy in this literature is not hours; it is pickups - and the relationship between guessed and actual pickups was effectively zero.
If you want the counts themselves and why no single average exists, see phone pickups per day. For what the notification research does and does not support, see what notifications actually do. For the wider picture, see the screens, attention and focus guide.
Limitations of this article
Three of the sources above share authors. Davidson and Ellis appear on both Parry (2021) and Ellis (2019); Ellis and Shaw appear on Andrews (2015). This is a small field, and it is not six independent teams.
Andrews (2015) is 23 people, and its duration finding was null. We have used it for the frequency pattern only.
Boase and Ling (2013) is not about screen time. It is 2008 data on calls and texts, included as historical context.
We did not print two figures from Boase and Ling - the transformed-variable correlations - because we read them in a page rendering rather than the publisher PDF.
Nothing here establishes that logs are correct. The literature establishes that estimates and logs disagree, and it assumes the log is the better of the two. That assumption is reasonable and, for the tool most people now use, unverified.

Human Operating System
Human Operating System is a research-led publication about the human mind under digital pressure. We report what the evidence does - and does not - support.
About Human Operating SystemSources & Further Reading
8 sourcesThese are the sources used for this article. Where a study's limits matter to the claim, those limits are kept in the citation.
View all 8 sourcesHide sources
- Parry, D. A., Davidson, B. I., Sewall, C. J. R., Fisher, J. T., Mieczkowski, H., & Quintana, D. S. (2021). A systematic review and meta-analysis of discrepancies between logged and self-reported digital media use. Nature Human Behaviour, 5(11), 1535–1547. Open source ↗
- Ellis, D. A., Davidson, B. I., Shaw, H., & Geyer, K. (2019). Do smartphone usage scales predict behavior? International Journal of Human-Computer Studies, 130, 86–92. Open source ↗
- Andrews, S., Ellis, D. A., Shaw, H., & Piwek, L. (2015). Beyond self-report: Tools to compare estimated and real-world smartphone use. PLOS ONE, 10(10), e0139004. Open source ↗
- Verbeij, T., Pouwels, J. L., Beyens, I., & Valkenburg, P. M. (2021). The accuracy and validity of self-reported social media use measures among adolescents. Computers in Human Behavior Reports, 3, 100090. Open source ↗
- Boase, J., & Ling, R. (2013). Measuring mobile phone use: Self-report versus log data. Journal of Computer-Mediated Communication, 18(4), 508–519. Open source ↗
- Jones-Jang, S. M., Heo, Y.-J., McKeever, R., Kim, J.-H., Moscowitz, L., & Moscowitz, D. (2020). Good news! Communication findings may be underestimated: Comparing effect sizes with self-reported and logged smartphone use data. Journal of Computer-Mediated Communication, 25(5), 346–363. Open source ↗
- Wu-Ouyang, B., & Chan, M. (2023). Overestimating or underestimating communication findings? Comparing self-reported with log mobile data by data donation method. Mobile Media & Communication, 11(3), 415–434. Open source ↗
- Ohme, J., Araujo, T., de Vreese, C. H., & Piotrowski, J. T. (2021). Mobile data donations: Assessing self-report accuracy and sample biases with the iOS Screen Time function. Mobile Media & Communication, 9(2), 293–313. Open source ↗
The Weekly System
Join the launch list for one calm, research-led email about attention, memory, learning and the systems designed to hold your attention. No noise, no panic and no unsupported certainty.