The Tipping Screen: Defaults Move Tips, and Pushing Too Hard Makes People Tip Nothing
Defaults move tips. Pushing the suggested amounts above the social norm reliably increases the number of people who tip nothing at all. And the "tipflation" story has no evidence behind it.
The screen that swivels toward you with three buttons on it is the most-complained-about interface of the last decade. The research is good, the effect is real, and the popular story is still wrong in a specific and interesting way.
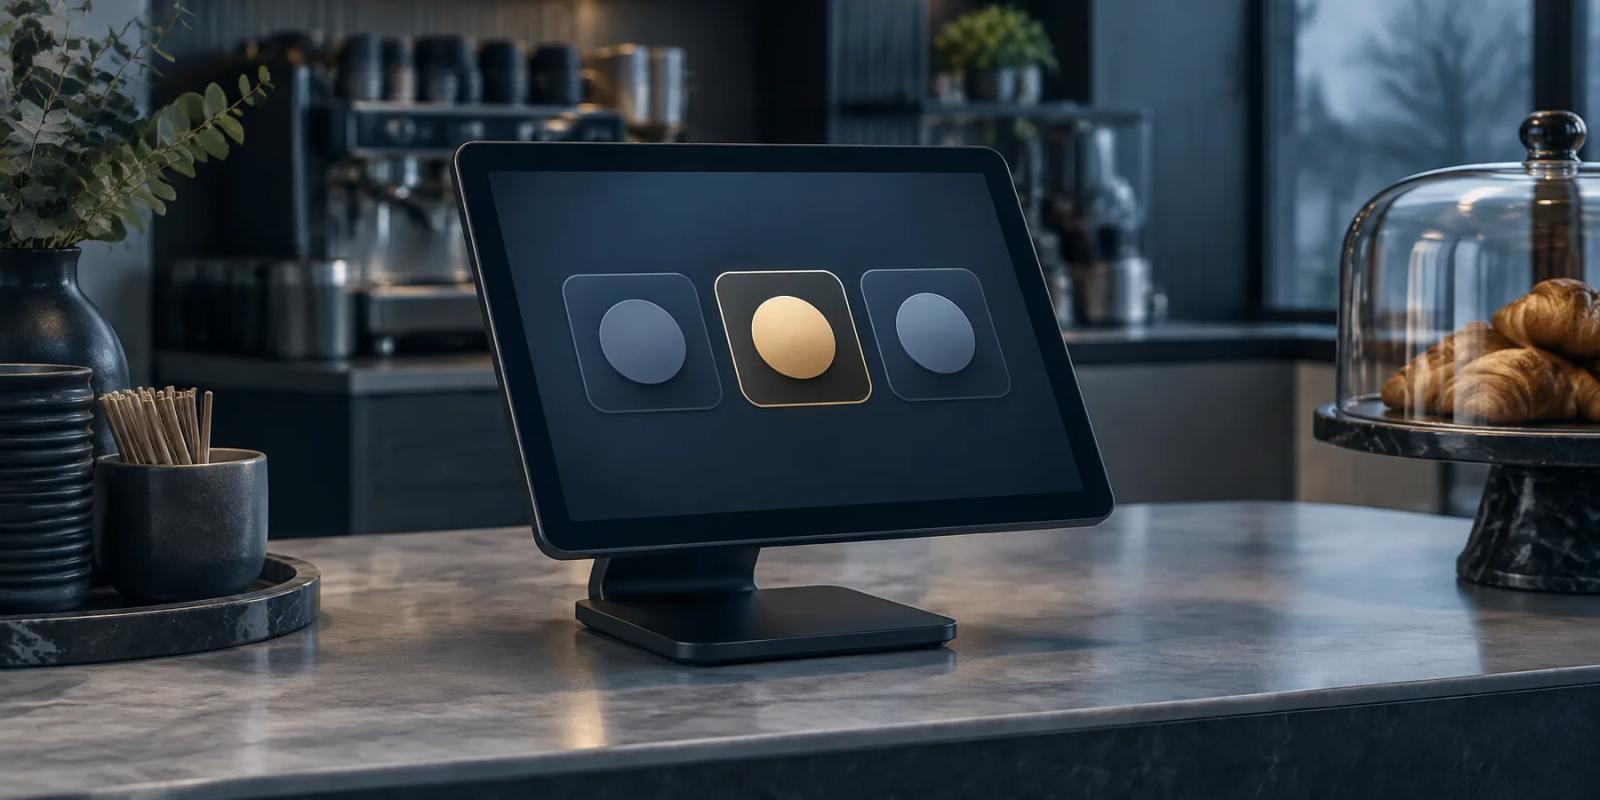
The screen that swivels toward you with three buttons on it is the most-complained-about interface of the last decade. It is also one of the few where the underlying research is good, the effect is real, and the popular story is still wrong in a specific and interesting way.
Three findings run through this literature.
Defaults move tips. That is well established, at enormous scale.
Pushing the suggested amounts above the social norm reliably increases the number of people who tip nothing at all. That is the finding the industry least advertises, and it appears in every study that looked for it.
“Tipflation” - the claim that tip percentages actually rose because of these screens - has no peer-reviewed or government evidence behind it, and the best available platform data shows tipping flat.
The taxi experiment
Haggag and Paci (2014), in the American Economic Journal: Applied Economics, used a natural experiment in New York City taxis. Two vendors ran different default screens. One showed $2/$3/$4 below a $15 fare and 20%/25%/30% above it; the other showed 15%/20%/25% at all fares.
That step change at $15 is a regression discontinuity, and the authors had 13,820,784 credit-card observations, with a main analysis sample of 6,218,196 rides.
The effects, as printed:
| Outcome | Effect | Baseline |
|---|---|---|
| Tip amount | +$0.276 to +$0.296 (SE $0.004-$0.010) | mean $2.221 |
| Tip percentage | +2.025 percentage points (SE 0.038) | 14.907% |
| Probability of zero tip | +0.017 (SE 0.001) | 0.028 |
The first row is “more than a 10 percent increase in the average tip,” in the authors’ words. The third row is the one to remember: the zero-tip rate rose by about 60% in relative terms.
The paper’s own summary, verbatim:
“we highlight a potential cost of setting defaults too high, as a higher proportion of customers opt to leave no credit card tip when presented with the higher suggested amounts.”
The finding that complicates it
If defaults are that powerful, the same manipulation should work in an app. It largely does not.
Chandar, Gneezy, List and Muir (2019), in an NBER working paper, ran a randomised defaults experiment inside Uber across 12,040,801 trips, part of a study covering more than 40 million UberX trips.
Presets ranged from $1/$3/$5 up to $2/$4/$6. Across that entire range:
- The tipping rate fell from 16.2% to 14.9%
- Average tip as a percentage of fare rose by only 2.5%
The authors describe “only a modest influence of defaults on tips,” and explicitly contrast it with the taxi result. Their explanation is the interesting part: tipping in an app happens in private; tipping in a cab happens with the driver three feet away.
For context from the same study: 16% of trips are tipped; roughly 60% of riders never tipped during the window and about 1% always did.
This paper is randomised, enormous, and closer to the technology under debate than the taxi study - which makes it the strongest single piece of evidence in the area, and it points away from the panic.
The randomised replication
Alexander, Boone and Lynn (2021), in Management Science, is the cleanest test of the shape of the effect: 94,571 orders from 24,637 customers of an app-based laundry service, randomised across 11 recommendation conditions - dollar triples, percentage triples, and round against non-round amounts.
Headline: “an increase in the mean tip suggestion of one percentage point led to an $0.17 increase in tips.”
And the backfire, again: larger ask-sizes reduced the likelihood of tipping at all once recommendations exceeded normative levels - the 15/20/25% conditions. There was no reliable effect on satisfaction, patronage frequency or spending.
Three studies, three designs, one consistent shape: raising the ask raises the average and raises the refusals.
Why the screen feels different from the jar
Two studies get at the thing people actually resent.
Dyussembayeva, Viglia, Nieto-Garcia and Mattila (2022), in the Journal of Business Research, found that an explicit request to tip reduces tip size by lowering perceived autonomy - but that the server’s physical presence mitigates that negative effect.
Warren and Hanson (2025), in the same journal, found that reduced tipping privacy at a digital point of sale damages what they call non-tip responses - return intent and word of mouth - through a split mechanism: reduced perceived control increases the tip, while reduced perceived generosity decreases it. Letting customers modify their initial selection mitigated the downstream damage.
That is a precise account of the swivel-screen experience. The interface extracts a slightly larger tip by removing your sense of control, and costs the business something in how you feel about coming back.
What people say about it
Pew Research Center (2023) surveyed 11,945 US adults on the American Trends Panel, 7-27 August 2023, margin of error ±1.4 points.
- 72% say tipping is expected in more places than five years ago
- On businesses suggesting tip amounts: 40% oppose, 24% favour, 32% neither
- Sit-down restaurant tipping: 15% is the most common answer at 37% of adults, 20% at 22%, less than 15% at 18%
- Only 34% say it is extremely or very easy to know whether to tip; 33% how much
The confusion is the finding. A third of American adults do not know when they are supposed to tip.
The claim with no evidence behind it
Here is where this article parts company with almost everything written on the subject.
We could find no peer-reviewed or government data establishing that tip percentages rose because tablet checkout spread.
The only systematic time series available are vendor platform reports. One major restaurant payments company’s own figures show full-service tipping at 19.4% in the first quarter of 2024 - flat against the previous quarter and stable since mid-2023 - and quick-service tipping unchanged at 16%. That is vendor data, covering only card and digital tips on that company’s own platform, with cash excluded and no sampling frame. We name it as vendor data and use it only to show that even the industry’s own numbers do not support the narrative.
There is a further wrinkle that almost nobody reports. A US Census Bureau working paper on tip reporting at American restaurants finds that tips are systematically under-reported, and that reported tips rose over the study period partly because of the shift from cash to card. A move from cash to card mechanically raises measured tipping without anyone tipping more.
So the one government study that touches the trend attributes it substantially to a payment-method change rather than to changed behaviour. We verified that from the paper’s abstract and record; we could not open the full text and have printed no internal figures from it.
What this leaves you with
The screen is doing something to you, and it is smaller than you think. The largest randomised test, on the exact technology, moved average tips about 2.5% across its entire preset range.
Observation is the active ingredient, not the software. The big taxi effect happened with a driver present. The small app effect happened in private. The autonomy research points the same way.
High suggested amounts backfire. Every study that measured it found that pushing past the norm increases the share of people who tip nothing - 1.7 percentage points off a base of 2.8% in the taxi data.
You are not imagining being asked more often, and 72% of American adults agree with you. Whether you are actually paying a higher percentage is not established by any evidence we could find.
Nothing here is advice about what to tip. This article is about what the interface does, not about what anyone is owed.
For a different interface that spends your attention on someone else’s behalf, see the psychology of waiting. For decline options framed to make refusing feel bad, see confirmshaming. For the wider pattern, see the persuasive design guide.
Limitations of this article
The Uber study is a working paper, not peer-reviewed, and we do not present it as published.
Three of its four authors were Uber employees at the time, and the paper states they “helped to develop and implement in-app customer tipping on Uber’s ridesharing app.” NBER flags a disclosed financial relationship. That cuts both ways: privileged access, and an interest in the finding that Uber’s defaults are not coercive. It is the single most important disclosure in this article.
The laundry-service experiment was run by the company, whose chief executive is thanked for conducting it; the researchers analysed rather than administered it.
We could find no peer-reviewed field experiment on physical countertop tablet tip screens in a bricks-and-mortar setting. Every strong study here is an app or a taxi meter. That is a real gap and it is the reason several claims in this article are hedged.
We read the Warren and Hanson and the Dyussembayeva findings in records and abstracts, not full texts, and have printed their mechanisms rather than their sample sizes or statistics.
We did not print figures from a 2021 scenario study finding that screen-based payment increased negative feelings without increasing tips, because the scenarios were hypothetical and the publisher is not an established behavioural-science venue.
We did not print any vendor consumer-survey figures, and we have labelled the one vendor platform series we mention as vendor data.

Human Operating System
Human Operating System is a research-led publication about the human mind under digital pressure. We report what the evidence does - and does not - support.
About Human Operating SystemSources & Further Reading
7 sourcesThese are the sources used for this article. Where a study's limits matter to the claim, those limits are kept in the citation.
View all 7 sourcesHide sources
- Haggag, K., & Paci, G. (2014). Default tips. American Economic Journal: Applied Economics, 6(3), 1–19. Open source ↗
- Chandar, B., Gneezy, U., List, J. A., & Muir, I. (2019). The Drivers of Social Preferences: Evidence from a Nationwide Tipping Field Experiment. NBER Working Paper 26380. Open source ↗
- Alexander, D., Boone, C., & Lynn, M. (2021). The effects of tip recommendations on customer tipping, satisfaction, repatronage, and spending. Management Science, 67(1), 146–165. Open source ↗
- Dyussembayeva, S., Viglia, G., Nieto-Garcia, M., & Mattila, A. S. (2022). Would you like to add a gratuity? When explicit requests hamper tipping. Journal of Business Research, 139, 908–917. Open source ↗
- Warren, N. B., & Hanson, S. (2025). Tipping privacy: The detrimental impact of observation on non-tip responses. Journal of Business Research, 186, 115008. Open source ↗
- Pew Research Center. (2023). Tipping Culture in America: Public Sees a Changed Landscape. Open source ↗
- Basker, E., Foster, L., & Stinson, M. (2024). Tip of the Iceberg: Tip Reporting at U.S. Restaurants, 2005–2018. US Census Bureau Center for Economic Studies Working Paper 24-68. Open source ↗
The Weekly System
The Weekly System has not launched yet. Join the launch list to hear when the first issue of this planned, research-led email is ready. No launch date or schedule has been announced.